HomeAcademic JourneyPublicationsResearch ToolsOutreach
Stakeholder Tools

Research Applications

Decision-support tools translating postdoctoral research into accessible, interactive platforms for conservation managers, wildlife ecologists, and game planners.

IIASA Postdoctoral Research

Scandinavian Species Distribution Models

Grid-level density and habitat projections for moose (Alces alces), roe deer (Capreolus capreolus), and grey wolf (Canis lupus) across 374 Scandinavian grid cells under five IPCC Shared Socioeconomic Pathways — designed for foresters, game hunters, and wildlife managers.

3 species 5 IPCC SSPs Map 2025–2060 History 1999–2060 374 grid cells Machine-learning SDMs Predator–prey ODEs

The tool couples hierarchical and stacked species distribution models — integrating climate, vegetation, and land-cover predictors — with ODE-based wolf–ungulate trophic interaction layers (Guisan & Thuiller, 2005; Chapron et al., 2016). The map slider restricts projections to 2025–2060, while per-grid time series retain the full 1999–2060 record so stakeholders can read projections against baseline variability. The application runs entirely in-browser via stlite; no install is required.

Open Application
SpeciesMoose · Roe Deer · Wolf
Climate scenariosSSP1-1.9, SSP1-2.6, SSP2-4.5, SSP3-7.0, SSP5-8.5
Map window2025–2060
Time-series window1999–2060 (historical + projection)
Spatial extent374 Scandinavian grid cells
Modelling approachHierarchical ML SDMs + ODE
RuntimeIn-browser (stlite / Pyodide)
Target usersForesters · Game hunters · Wildlife managers
GitHub repositoryWolf-model
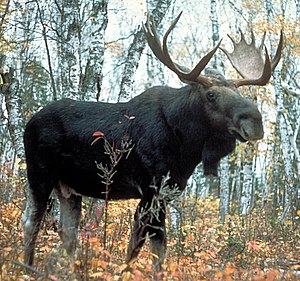
Moose
Alces alcesWikimedia Commons, Public Domain
Roe deer
Capreolus capreolusWikimedia Commons, CC BY-SA
Grey wolf
Canis lupusWikimedia Commons, CC BY-SA
Scandinavian Species Distribution Models — v2.0
Moose · Roe Deer · Grey Wolf · Five IPCC SSPs · Map 2025–2060 · Time series 1999–2060
Live · In-browser
Open in full screen for the best experience — first load takes 20–40 seconds
IIASA Postdoctoral Research

Forage Energy Meta-Database

A curated, interactive meta-database of plant metabolizable energy content, digestibility, and Jacobs' D foraging preference indices for boreal ungulates — enabling quantitative habitat management and population energy-budget parameterisation.

72 records 3 species 4 seasons ME (MJ/kg DM) Jacobs' D index Open contribution

The application synthesises Menke energy coefficients with Jacobs' D preference indices to compute preference-weighted metabolizable energy (ep) for each plant species. Use the Database tab to browse and filter records, the Calculator to compute energy budgets, and the Contribute tab to submit new data.

View Source on GitHub
Records72 plant–species–season entries
SpeciesMoose · Roe Deer · Red Deer
SeasonsSpring · Summer · Autumn · Winter
Key variablesME, Jacobs D, e_p, Confidence
Application tabsDatabase · Calculator · Contribute · About
Use caseWildlife management · Population modelling
Moose
Alces alcesWikimedia Commons, Public Domain
Roe deer
Capreolus capreolusWikimedia Commons, CC BY-SA
Red deer
Cervus elaphusLuc Viatour, CC BY-SA 3.0
Forage Energy Database
Animal Forage Metabolizable Energy & Preference Index · 72 records · 3 species
Interactive · Open Access
Open in full screen for the best experience
Frontiers in Ecology & Evolution (in review)

AlderGuard — Alnus Ecoepidemic Decision-Support

An in-browser decision-support tool for the black alder (Alnus glutinosa) — alder leaf beetle (Agelastica alni) — tachinid parasitoid (Meigenia mutabilis) — insectivorous-bird ecoepidemic system. Pick any of 41 Natura 2000 alluvial-forest sites across Europe on the interactive map and the 23 model parameters auto-calibrate from a continuously-updated literature metadatabase.

41 EU sites 23 parameters Natura 2000 habitat 91E0 Literature-pooled 95% CI LLM literature agent Hybrid ODE + annual map Python + R packages

AlderGuard couples a within-season 4-state ODE system (susceptible larvae, parasitised larvae, adult parasitoids, defoliation) with an annual Beverton-Holt discrete map for beetle reproduction, parasitoid overwinter survival, and canopy feedback. A scheduled GitHub-Actions literature agent continuously grows the parameter metadatabase from OpenAlex, Europe PMC, Semantic Scholar, and Crossref, feeding reviewed values and 95 % confidence intervals onto every slider. Companion Python (pip install git+...#subdirectory=alderguard-py) and R (remotes::install_github) packages reproduce every analysis programmatically.

Open Application Source code & packages
Target systemAlnus glutinosa · Agelastica alni · Meigenia mutabilis · passerines
Sites41 Natura 2000 alluvial forests (19 countries)
ModelHybrid within-season ODE + annual map
Parameters23 (attack rate, mortalities, carrying capacity, control efforts, thresholds)
Core featuresSimulation · Equilibrium · Bifurcation · Fitting · Early warnings · Control
Literature agentOpenAlex + Europe PMC + Semantic Scholar + Crossref · daily cron
RuntimeIn-browser (Plotly.js + Leaflet); no install
Companion packagesPython 3 + R (same model, same calibration JSON)
GitHub repositoryalderguard
Alnus glutinosa
Alnus glutinosaNikanos, Wikimedia Commons, CC BY-SA 2.5
Agelastica alni
Agelastica alniAndré Karwath, Wikimedia Commons, CC BY-SA 2.5
Tachinid fly
Meigenia mutabilis (Tachinidae)Muhammad Mahdi Karim, Wikimedia Commons, CC BY-SA 3.0
AlderGuard — Ecoepidemic Decision-Support
41 European Alnus sites · 23 parameters · Literature-pooled CIs · Daily LLM metadatabase update
Live · In-browser
Open in full screen for the best experience

Cite: Ghosh, S. et al. (2026). AlderGuard: Hybrid seasonal-annual modelling and early warning signals for the Alnus-beetle-parasitoid-bird ecoepidemic system. Frontiers in Ecology and Evolution (manuscript submitted).